Version 6.49 released on August 3, 2019, presents two major improvements:
- The Notifications module to collect concise and up-to-date information on your orders and price alerts
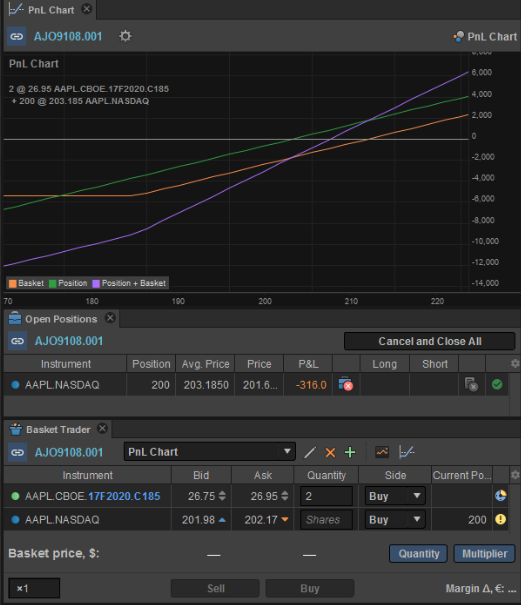
- PnLChart to evaluate potential profit or loss for your trades
Notifications
The Notifications module keeps all updates on your orders in one simple list. Read them at your convenience!

- Filter notifications and price alerts by type
- Mark all as read – or clear them in a single click
- Start the list anew with every terminal restart
- Set up global notification preferences right in the module
Check out the new feature and share your feedback! Let us know and we’ll consider adding your suggestions to the roadmap like we did with the next one.
PnL Chart
Options strategy analysts, advisors, and traders – rejoice! We’ve implemented a simple, yet powerful PnL tool for your convenience!
The PnL Chart shows what will happen when the underlying asset price reaches a certain level. The Chart visualises potential outcomes of your trades at the moment of expiration.

Why do I need it?
- To draw risk graphs for single derivatives or combined strategies based on the same underlying asset
How does it work?
- Click on an existing position in Account Summary or Open Positions to select the PnL Chart item in a context menu
- Emulate a would-be trade using Basket Trader and press the PnL Chart button at the module header
Any suggestion for future updates? Give us a shout at support@exante.eu!
This article is provided to you for informational purposes only and should not be regarded as an offer or solicitation of an offer to buy or sell any investments or related services that may be referenced here.


